
Show your biological is working in the soil.
See living-soil activity respond where your product was applied, before the next sales cycle.
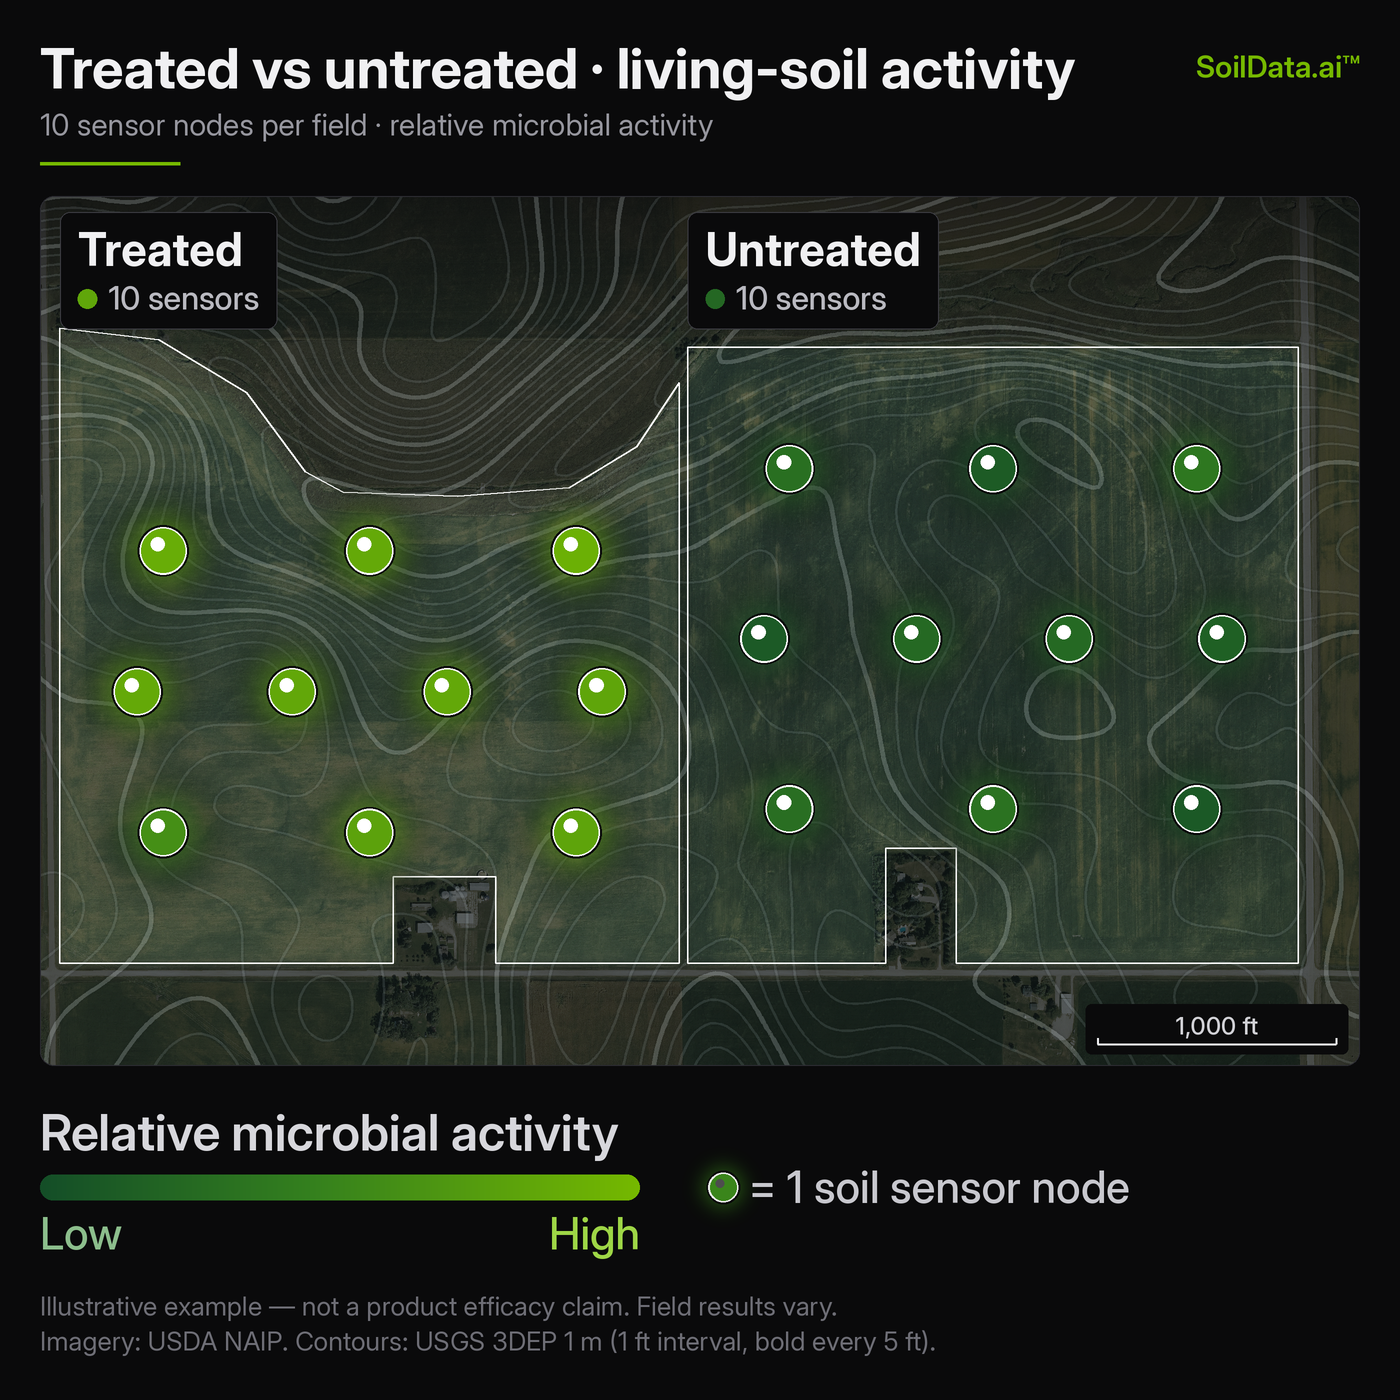
Our sensors and the SoilData.ai™ platform track living-soil activity continuously at each node, alongside soil and air readings, so commercial teams can show treated vs untreated response for new products and practices.
THE DELIVERABLE